Who Will Benefit From Student Loan Forgiveness?
Published 4th Oct 2022Interested in learning which geographic areas will benefit most and least from President Biden’s recent decision to forgive up to $10,000 in federal student loans?
Powerlytics proprietary database provides insights into the question by exploring which States, MSA and ZIP Codes showed the highest and lowest concentrations of student loan debt as measured by looking at student loan interest payments from both private and public student loan debt.
Data Source and Analysis Overview
- Powerlytics proprietary database includes accurate financial data on over 200 million adults and 150 million households down to the highly granular 9-digit ZIP Code level.
- Key data elements include income, investable assets and the focus of this piece, student loan interest payments.
- Analysis includes low to moderate income households looking specifically at adults with $85,000 or less in annual income.*
Biggest Winners: Cold Weather States
Minnesotans appear to be the biggest beneficiaries with 20.3% of adults making less than $85,000/year showing student loan interest expense.
Nevada residents will likely benefit the least as only 7.9% of adults making under $85,000/year had student loan interest expense.
Other New England and Upper Midwest states will likely be big winners while Sunbelt states including California will only see a small percentage of their population benefit.
Will Educationally Focused MSAs See the Biggest Benefits? Yes and No.
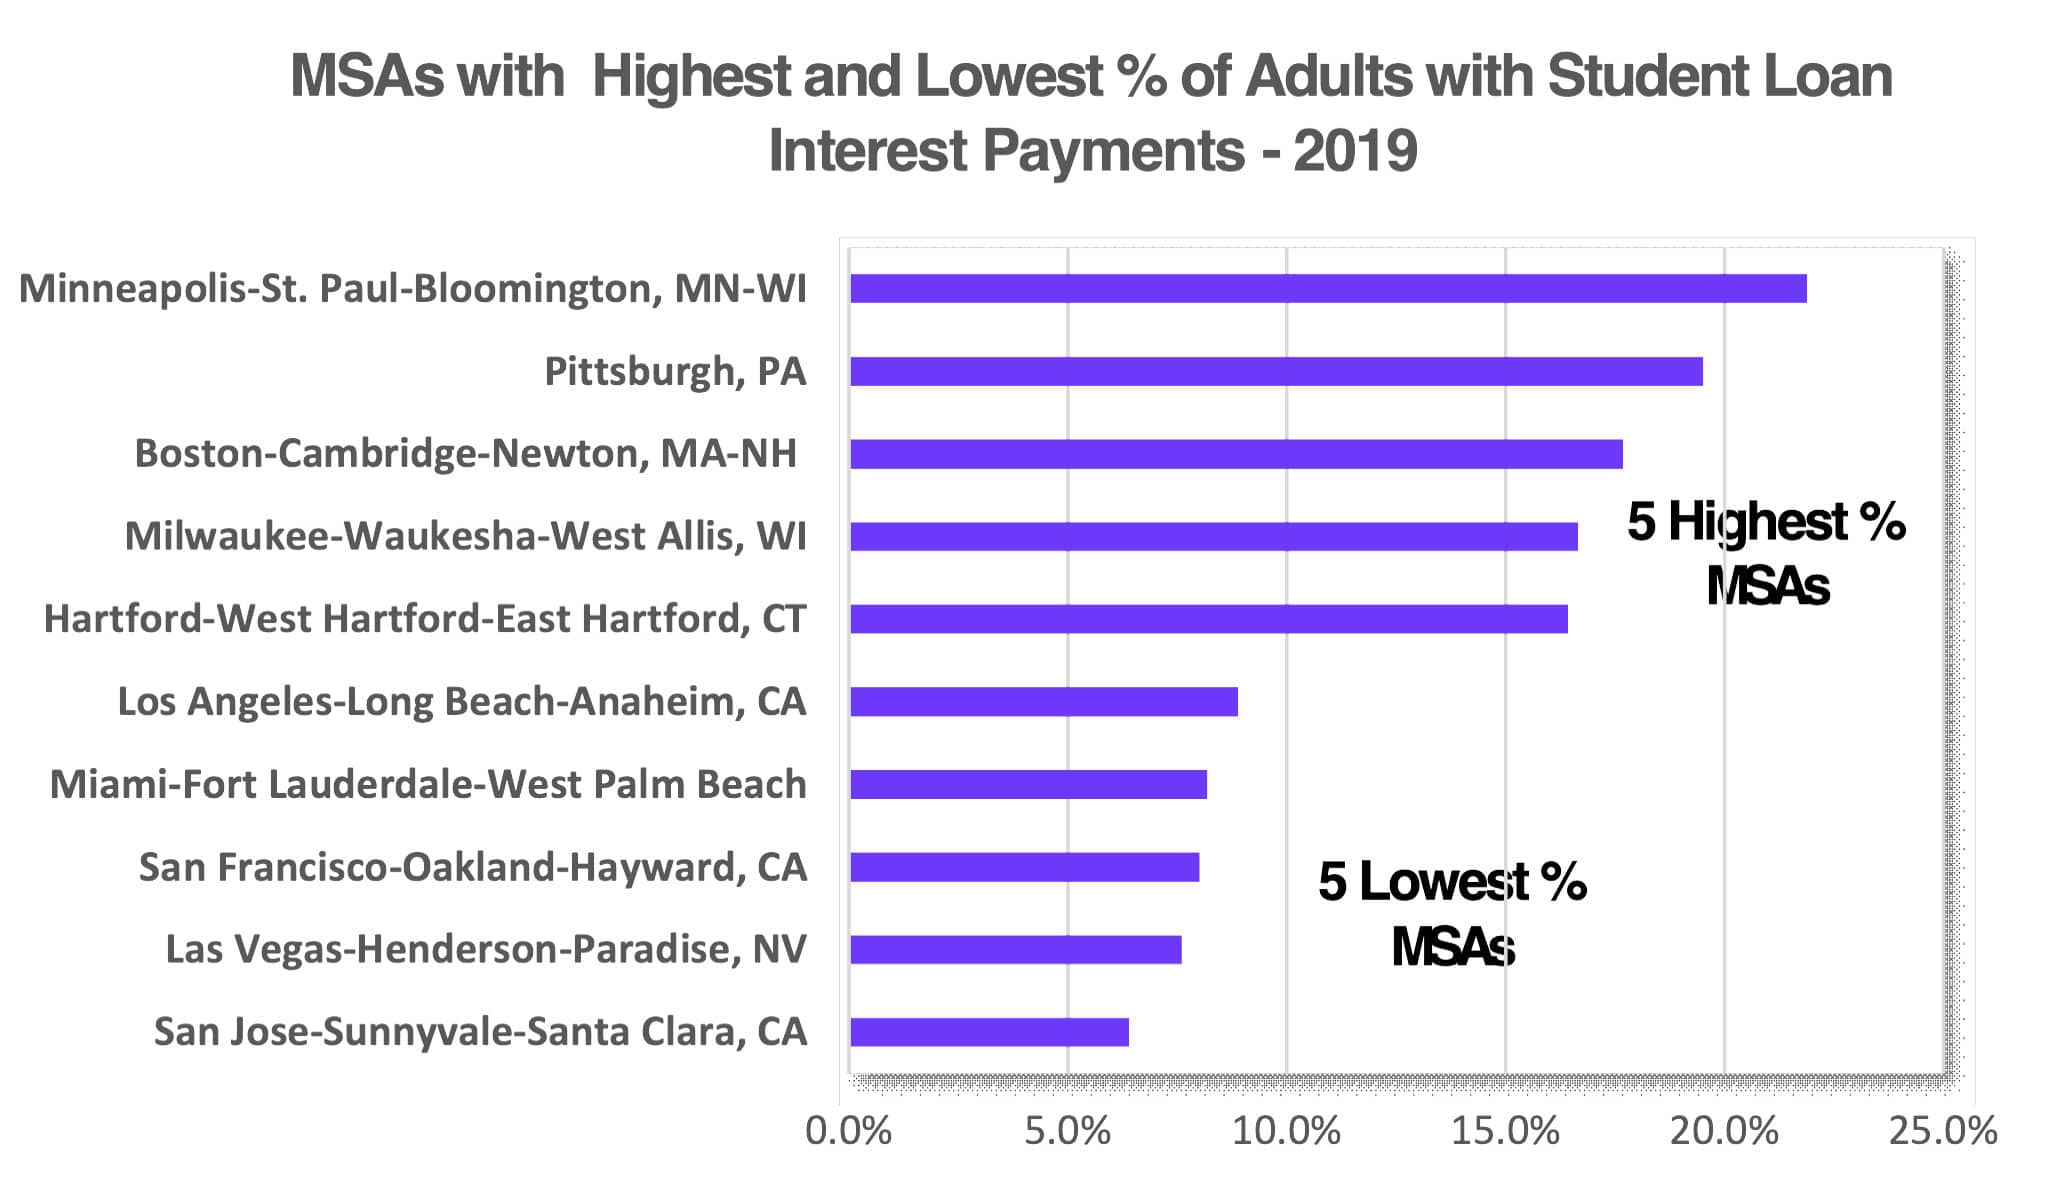
Drilling down to MSAs, we see that Minneapolis-St. Paul-Bloomington come out on top at 21.9% while San Jose-Sunnyvale-Santa Clara MSA is at the very bottom at only 6.4%.
We fully expected to see a higher education center like Boston also have a high percentage of adults with student loan debt and in fact, it ranks #3 on our list. But does the “education-orientation translate to high student loan debt” dynamic hold true across the country? To test the hypothesis, Powerlytics reviewed WalletHub’s recent ranking of the top 150 MSAs from most to least educated.
- Two of the MSAs with the highest student loan debt came in near the top of the WalletHub ranking: Boston at #6 and Minneapolis at #19. However, the Milwaukee MSA was 4th highest in percentage of adults with student loan debt but only 58th on the WalletHub list.
- Another interesting outcome was San Jose-Sunnyvale-Santa Clara CA ranked absolute lowest on our student loan list. In addition to being the home of Silicon Valley with many hyper-educated engineers and tech entrepreneurs, this MSA came in as the #2 most educated MSA in WalletHub’s ranking.
- A number of factors might be driving this low student loan result including California’s broad array of lower-cost higher education options anchored by its well-funded state university and community college systems. Clearly these and perhaps other reasons render the correlation between MSA educational attainment and the likelihood it will benefit from student loan forgiveness as inconsistent.
Urban ZIP Codes Neighborhoods Likely to Benefit the Most
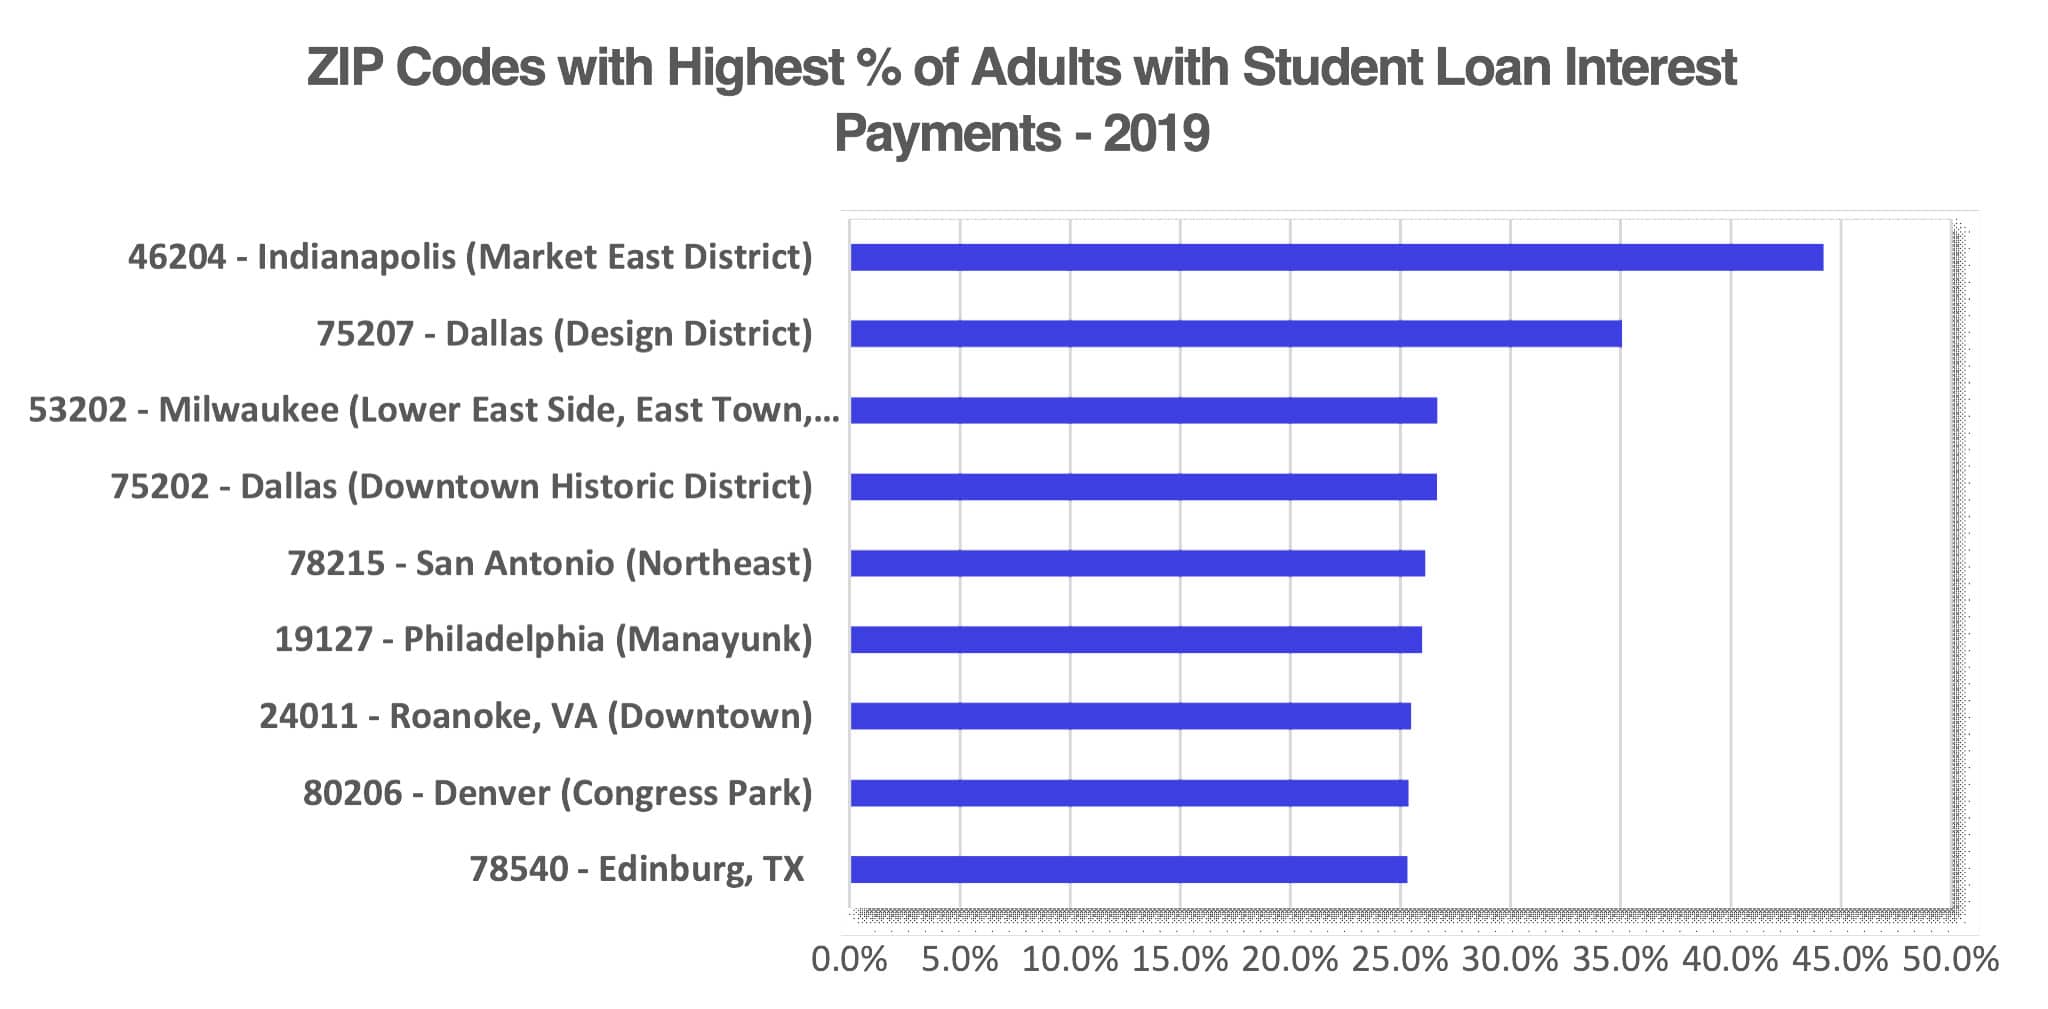
The ZIP Codes with the highest concentration of student loan expense cut across regions but almost of these ZIP Codes fell in urban centers that likely are home to a high number of recent college graduates. The one exception is college town Edinburg, TX, home to University of Texas Rio Grande Valley.
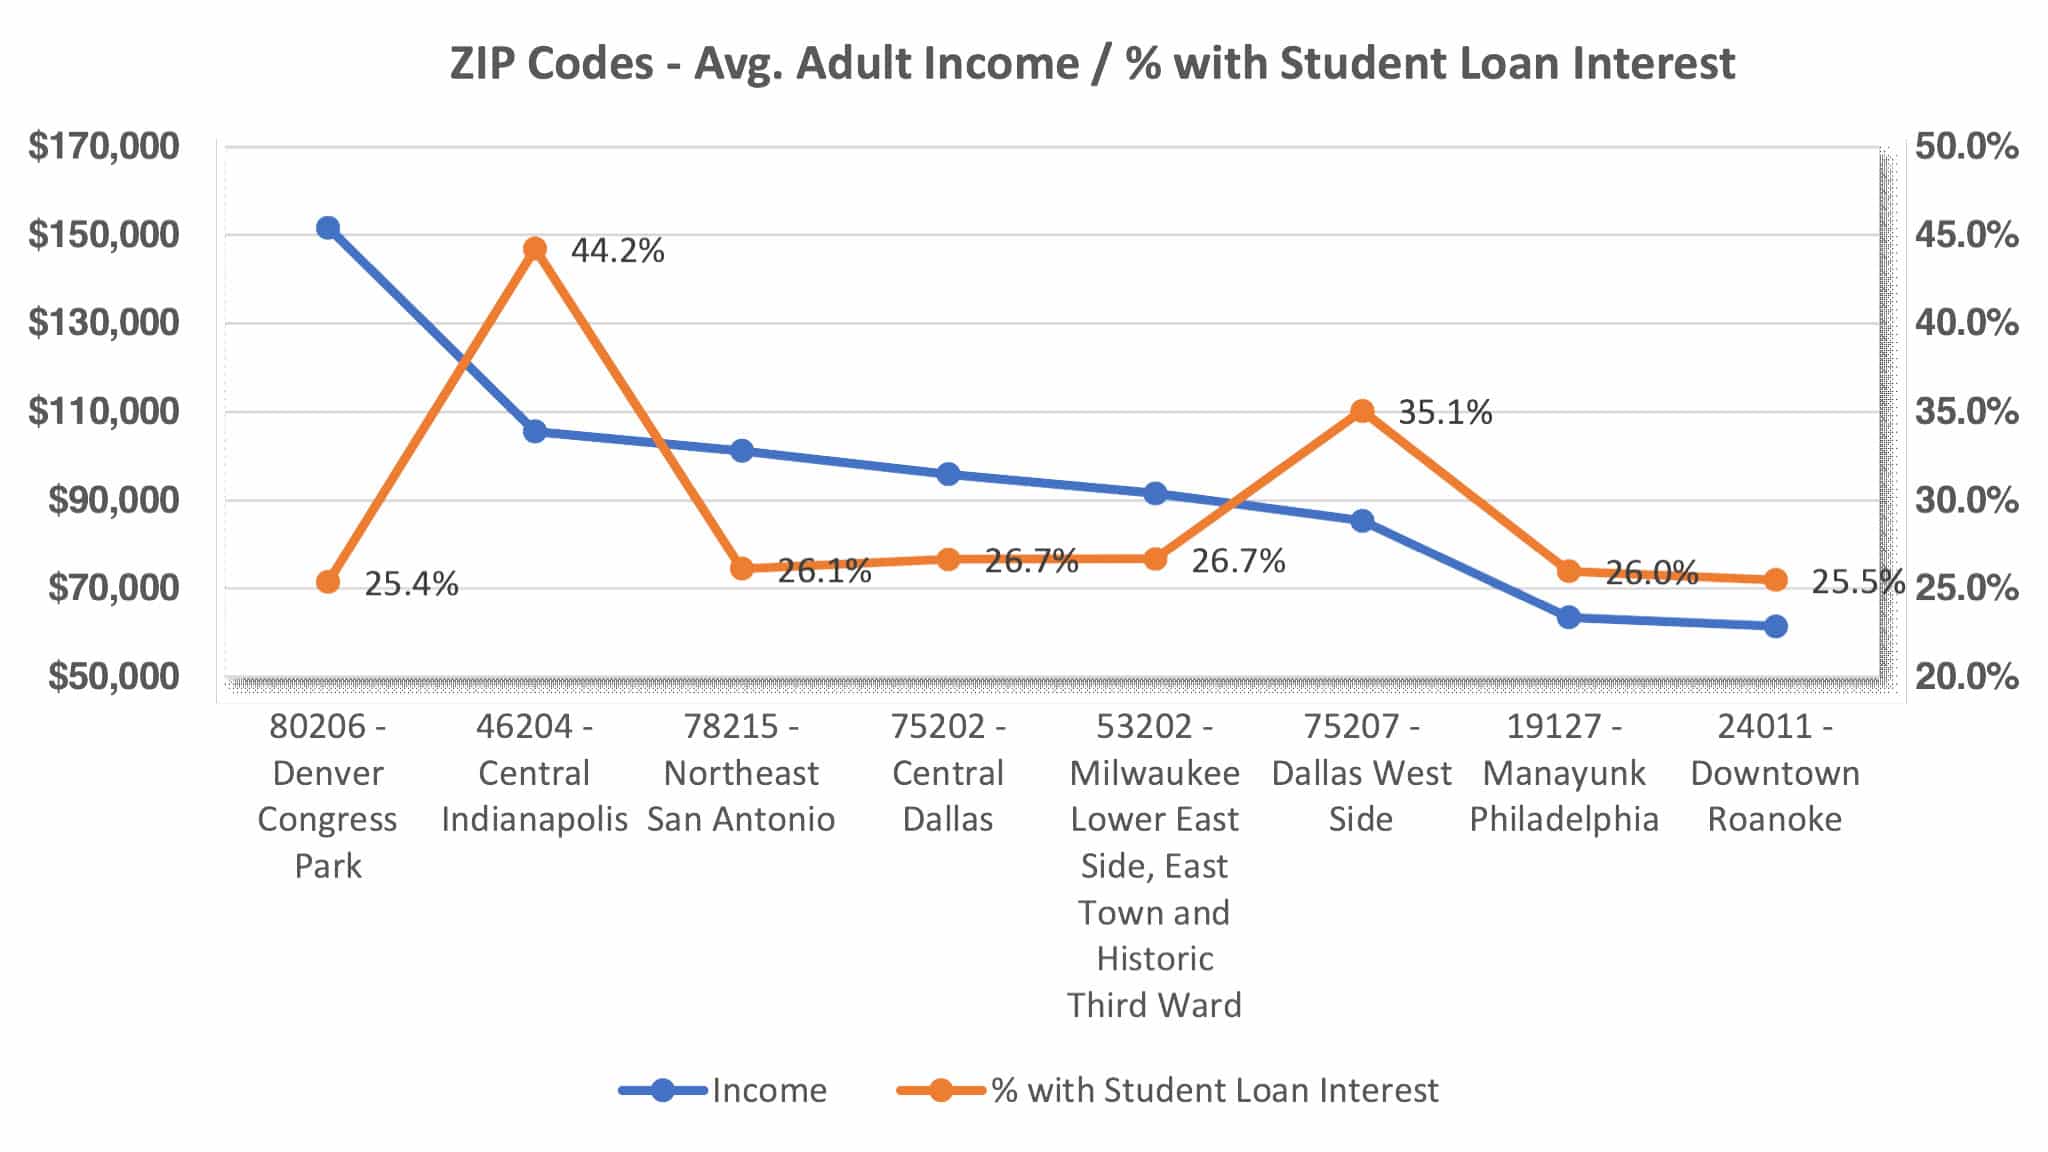
The final part of the analysis included student loan interest correlation to income. The chart below plots 2019 average adult income for these top ZIP Codes next to the % of adults with student loan interest. From this small sample, the correlation appears to be weak. While Central Indianapolis (46204) shows consistency with the second highest average adult income at $105,600 and the highest percentage of adults with student loan interest, Denver’s Congress Park (80206) shows the opposite dynamic with the highest average adult income at $151,725 but the lowest percentage of adults with student loan interest. While we might expect student loan interest to align with a more educated population and thus higher incomes as we see in Central Indianapolis, it also possible that higher income individuals are more able to pay down their student which may be what we are seeing In Denver’s Congress Park ZIP Code.
Summary
These results have generated some robust discussion and include many theories as to why Minnesota has such high student loan debt or why California and Silicon Valley are so low.
What do you think is driving these geographic trends? We would love to hear your thoughts!
Email us at sales@powerlytics.com
*Time Period – 2019 (due to Covid federal student loan payment freezes, 2019 is the last full year in which payments were made).


