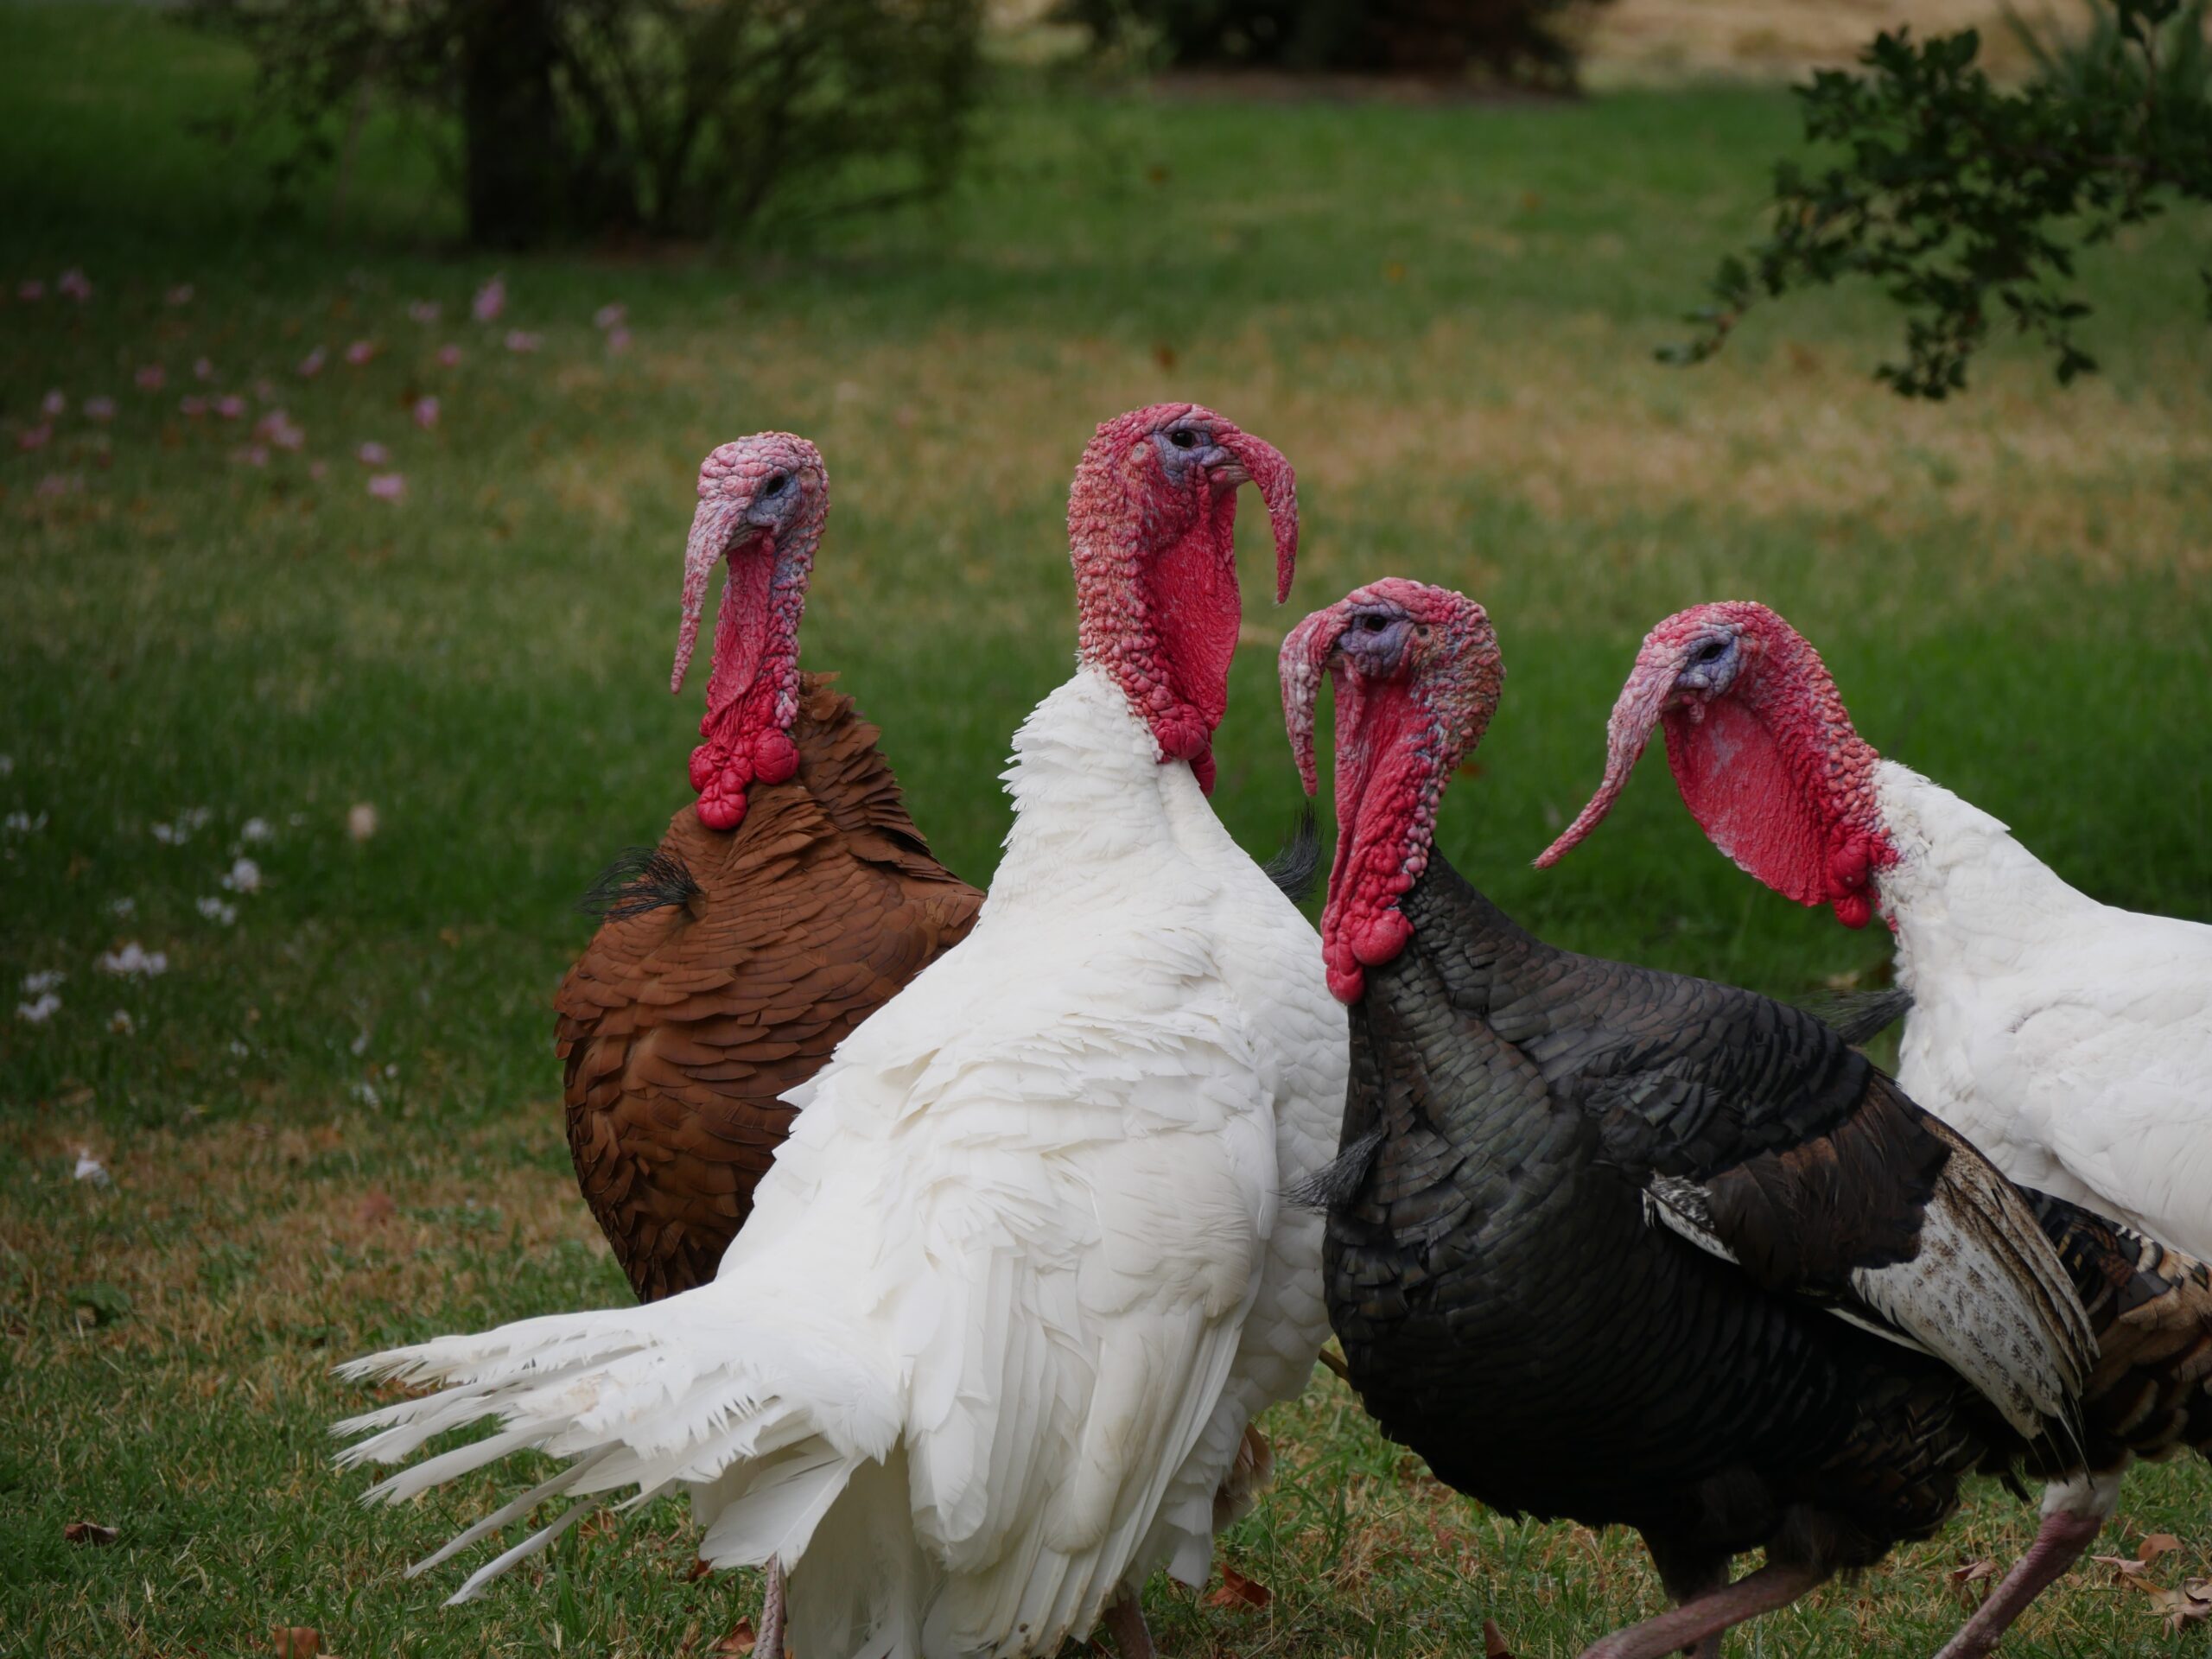
Turkeys don’t fly themselves to the grocery store: Everything you wanted to know about the business of Thanksgiving
Published 21st Nov 2016When we give thanks at Thanksgiving, we don’t mention money. Friends, family, our homes, and our communities – these are the things we are grateful for.
And yet, we can’t have Thanksgiving without business. Turkeys don’t fly themselves to the supermarket (domestic turkeys actually can’t fly at all), and pies don’t bake on their own.
The businesses that fuel Thanksgiving, like turkey processors, cranberry farmers, and breweries, tend to be in competitive industries. In many cases, the growth in the number of businesses is outpacing the pace of market growth.
The Powerlytics team pulled financial information for a dozen industries, all of which have a seat at the Thanksgiving table, including poultry producers, canners, and even frozen pie and cake bakeries (of course we know yours are homemade, wink wink).
The industries we pulled were categorized by NAICS codes and span the years 2011 through 2015. NAICS is the government’s classification code used for gathering economic statistics, and sometimes the categories can be quite broad. There isn’t a separate code for cranberry sauce so we used the code for specialty canners. Turkey processors aren’t separated from poultry processers.
The annual financial results of these industries give us an intriguing picture of the companies fighting for their share of the pie.
— Profit margins – defined as EBITDA as a percentage of net sales – were roughly the same – between 9.5 percent and 10.5 percent of all of the industries.
— In nearly every industry we gathered data on, more businesses existed in 2015 than in 2011. But the size of the market didn’t always grow as fast, and some even lost ground.
— Between 2011 and 2015, the number of U.S. distilleries more than doubled, from 212 to 532. Gross sales rose from $4.8 billion to $5.2 billion.
— The number of breweries exploded from 728 in 2011 to 2,891 in 2015. Gross sales rose from $27.9 billion to $30.8 billion over that time. There was a lot of variation in this group. In 2015, the bottom 20 percent of breweries had sales of less than $5.3 million. The top 20 percent had sales above $99.4 million, and the largest brewery in our data set had sales of $3 billion.
By the way, if micro and nano brews seem more expensive, our data backs up your feelings. Profit margins, as defined as EBITDA as a percent of net sales, stood at around 23 percent for the smallest brewery in our data set. It did about $4,000 in business, and profited to the tune of about $1,000. At the biggest brewery, the profit margin was 7 percent, and the top 20 percent had margins of 8.3 percent. Average margins in the industry stood at about 9 percent.
The folks that make butter, cranberry sauce and pies didn’t face the same level of new market entrants.

The number of poultry processing facilities, which handle both chickens and turkeys, declined from 576 to 538. They sold a lot of birds. Sales went from $89 billion in 2011 to $93 billion in 2015. The smallest poultry producer in our data set did about $52,000 in business in 2015. Revenue figures climb pretty quickly, because 75 percent of producers had top line numbers exceeding $87 million.
Why is this important? As you can see from the table above, some of these industries are becoming increasingly crowded. Lenders and investors need this type of contextual information to assess the business environment that a company wants to work in.
Powerlytics’s comprehensive data set goes beyond gross sales figures and the number of establishments. This information can be broken down at the county level, at the state level, and according to business formation. So, for example, a loan officer considering an application from a small brewery could use our data to look up standard income statement ratios for a brewery in whatever county she needed to. She could also parse differences between sole proprietorships and corporations. And make comparisons between similarly sized businesses by dividing data into quartiles – as we did for our brewery example above.
When you’re spooning an extra pat of butter on your mashed potatoes on Thanksgiving, it’s OK if you aren’t thankful that you know the butter came from one of roughly three dozen butter creameries.
But if you are an investor, you can be thankful that you can grab the quick ratio for just about any business in the country.
Happy Thanksgiving.
Read next

Published 3rd Oct 2016
ArchivedFor Middle Class, Student Loan Debt a Powerful Economic Indicator
Americans owed nearly $1.2 trillion in student loan debt as of March 2015. That’s trillion with a T. While that number is massive, student loan debt doesn’t impact all areas of the...
Read Article